Analiza Pathak
Born in Guwahati, raised in Mussoorie and Delhi, She grew up reading magazines more than textbooks. She is an experienced writer/editor and has shifted focus to various aspects of communication. Her a … Read More

Born in Guwahati, raised in Mussoorie and Delhi, She grew up reading magazines more than textbooks. She is an experienced writer/editor and has shifted focus to various aspects of communication. Her a … Read More

TMC’s rebel faction leader Kakoli Ghosh Dastidar wrote to Lok Sabha Speaker Om Birla seeking expulsion of TMC leader Kalyan Banerjee. Published: June 16, 2026, […]
Abhijeet Sen Abhijeet Sen is a digital journalist with over five years of experience specializing in the intersection of Indian politics, global economics and business […]
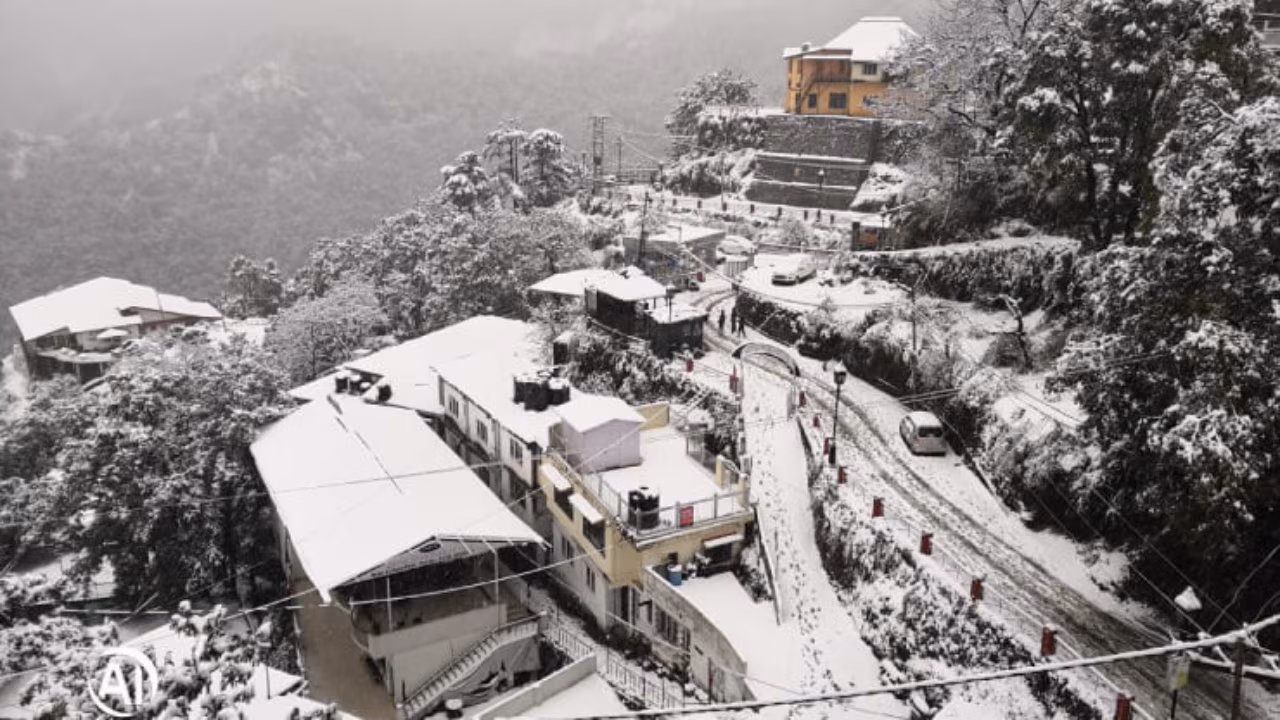
According to the weather department data till 5:30 pm, Dehradun recorded a maximum temperature of 32.6 degrees Celsius, three notches below normal, and a minimum […]