New Delhi: Modi govt lifts restrictions on commercial LPG supply as West Asia crisis eases.
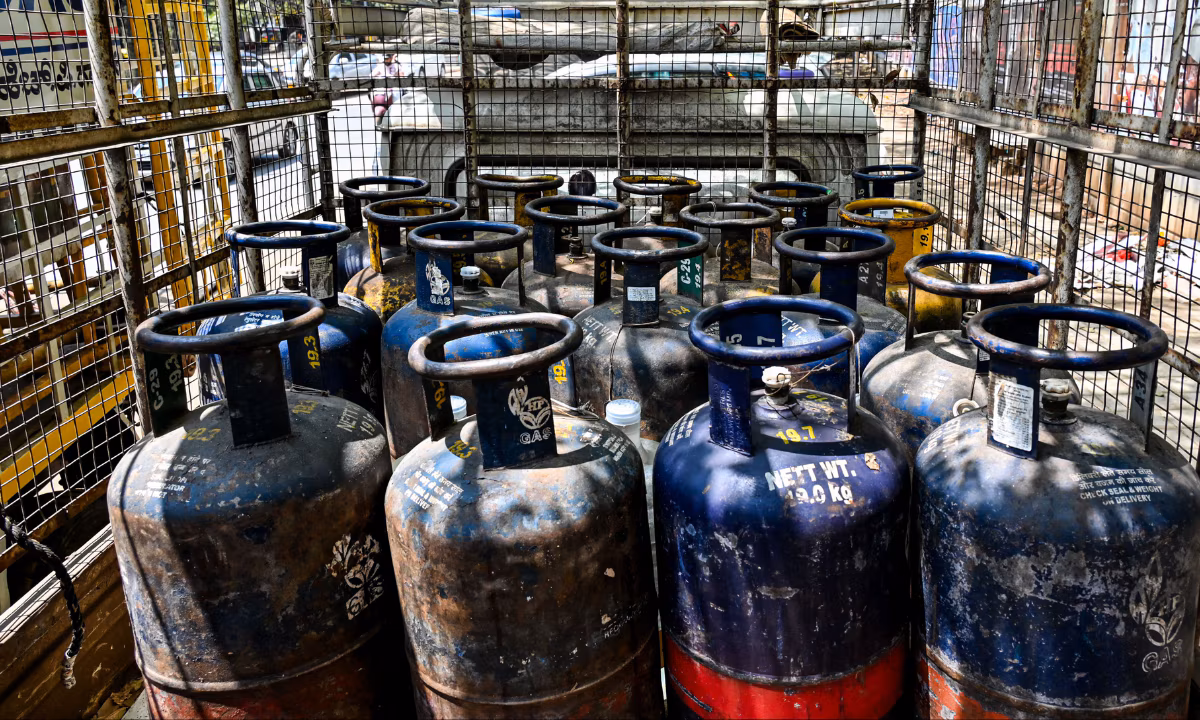
New Delhi: Modi govt lifts restrictions on commercial LPG supply as West Asia crisis eases.
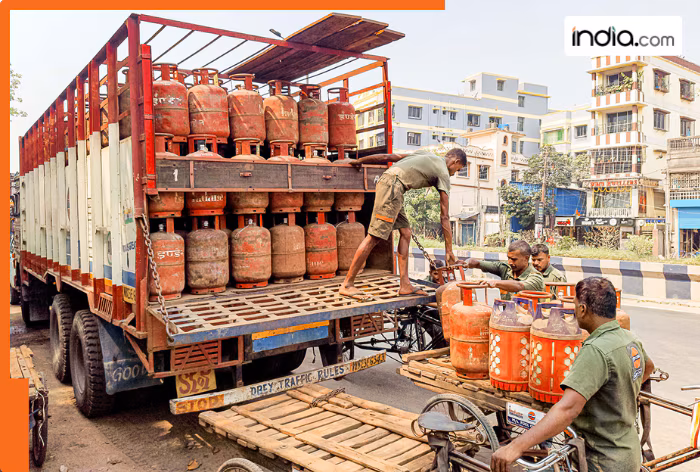
Home News LPG, PNG prices today: CNG prices hiked, check domestic, commercial cylinder rates in Delhi, Mumbai, Chennai, other cities LPG, PNG Prices City Wise: […]
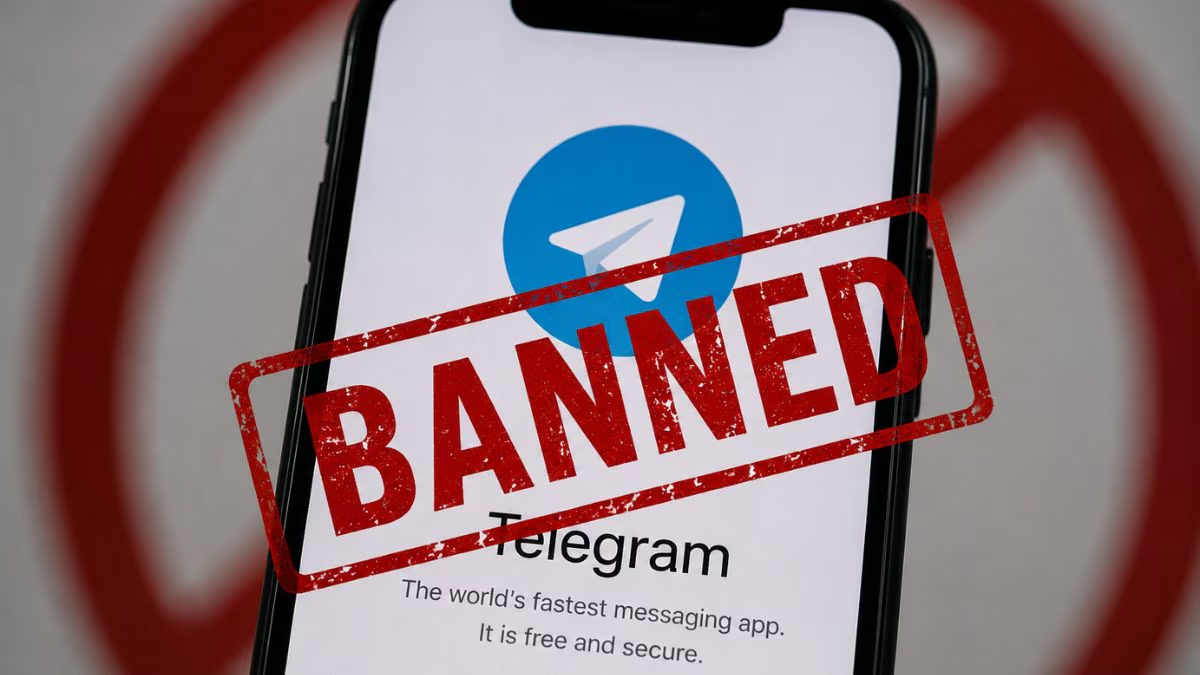
The National Testing Agency said Telegram was allegedly exploited by exam fraud networks to share bogus question papers and manipulate timestamps to falsely suggest that […]
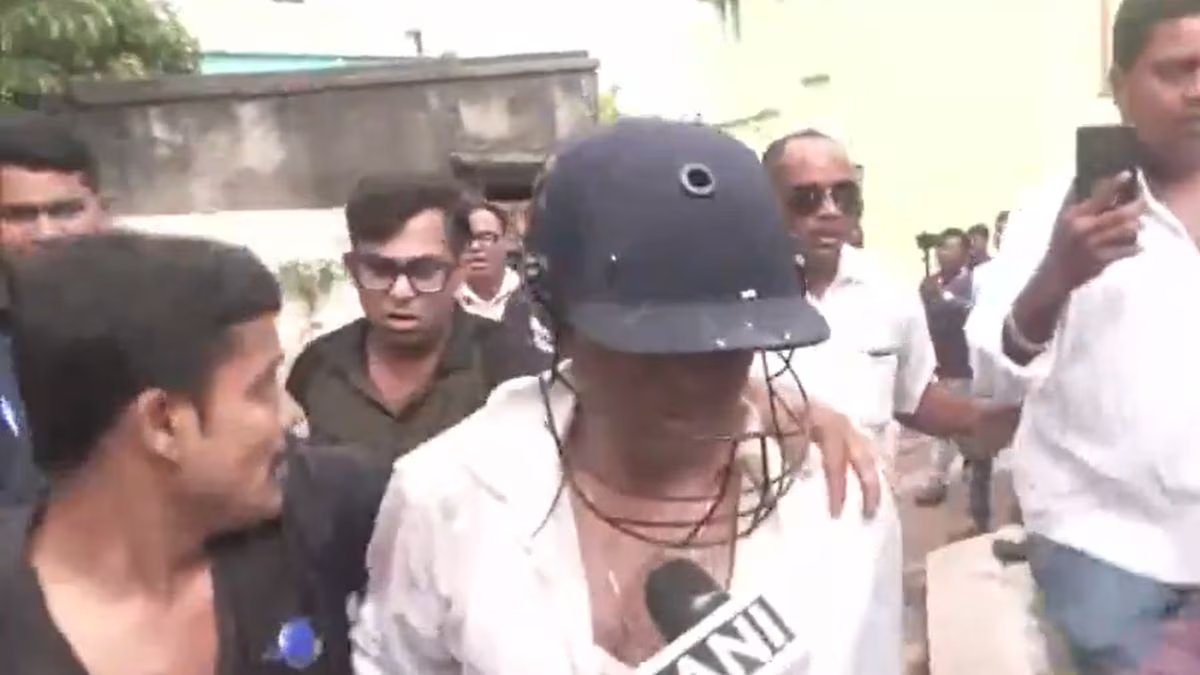
The West Bengal Criminal Investigation Department (CID) has officially taken charge of the probe involving Trinamool Congress leader Abhishek Banerjee, intensifying the political and legal […]